One of outcomes of Hakan Forss’ session on depth of Kanban practices at the Kanban Leadership Retreat was the use of radar charts to show the maturity of a Kanban implementation. The whole discussion started with the realization that different teams adopt Kanban practices in different orders, thus we need a tool to assess them somehow.
Radar charts, or spider charts, seem to be good tools for visualizing how well a team is doing. However, when you start using them, interesting things pop up.
Coming Up with Results
First, how exactly do you tell how mature an adoption of a specific practice is? How far are we on a scale from 0 to 5 with visualization? Why? What about limiting work in progress? Etc.

One of my teams decided to describe 0 as “doing nothing” and max as “where we think we would like to be.” With such an approach, a radar chart can be treated as a motivational poster – it shows exactly how much we still should do with our Kanban implementation. It also means that the team aims at a moving target – as time passes they will likely improve and thus set more ambitious goals.
There is also a drawback to this approach. Such an assessment is very subjective and very prone to gaps in knowledge. If I think that everything there is to be done about WIP limits is to set those numbers in each column on the board and avoid violating them, I will easily hit the max on the “limiting WIP” axis. Then of course I’ll award myself the Optimist of the Week and Ignorant of the Month prizes, but that’s another story.
On a side note: I pretty much expect that someone is going to come up with some kind of a poll with a bunch of questions that do the job for you and tell you how far you are with each practice. And, similarly to the Nokia Test, I think it will be a very mixed blessing with negatives outweighing positives.
Finding Common Results
The second issue is about gathering collective knowledge from a team. People will likely differ in their judgment – one would say that visualization is really mature, while the other will state that there’s lot more to be done in there.

The obvious strategy is to discuss the areas where the differences are the biggest. However, it’s not a fancy flavor of planning poker so, for heaven’s sake, don’t try to make everyone agree on the same number. It is subjective after all.
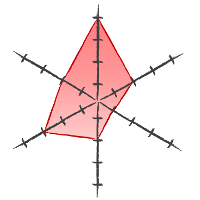
One more interesting trick that can be done is putting all the results on a single radar chart with min and max values creating the borders of an area. This area will tell you how your Kanban implementation is perceived.

With such a graph not only do you want to have this bagel spread as far as possible but also to have it as thin as possible. The latter may be even a more important goal in closer perspective as a wide spread of results means that team members understand the tool they use very differently.

Comparing Results between Teams
The third issue pops up when you compare graphs created by different teams. Let’s assume you have both issues above solved already and you have some kind of consistent way of judging maturity of Kanban practices. It is still very likely that different teams will follow different paths to Kanban adoption, thus their charts will differ. After all this is what launched the whole discussion in the first place.

It means, however, that you may draw very interesting conclusions from comparing the results of different teams. You don’t try to say which team is better and which needs more work. You actually launch discussions on how people are doing things and why they think they are good (or bad) at them. You enable collaborative learning.
As a bonus you can see patterns on a higher level. For example, people across the organization are doing pretty well with visualization, have very mixed outcomes in terms of managing flow and are not that good when it comes to limiting WIP. It can help you focus on specific areas with your coaching and training effort.
Besides, it is funny to see how a personal kanban maturity radar chart can look like.

To summarize, radar charts are nice visuals to show you where you are with your Kanban adoption, but they may, and should, be used as a communication enabler and a learning catalyst.


